Spatial-source comparison
Shoreline in Four Layers
Can an attractive map make its different source dates and coverage gaps understandable at first reading?
- Student
- Aiden Cho / Year 3
- Course
- GEO 301 / Spatial Evidence Analysis
- Mentor
- Jonah Kim
- Source
- TH-TEACH-GEO-01
Question
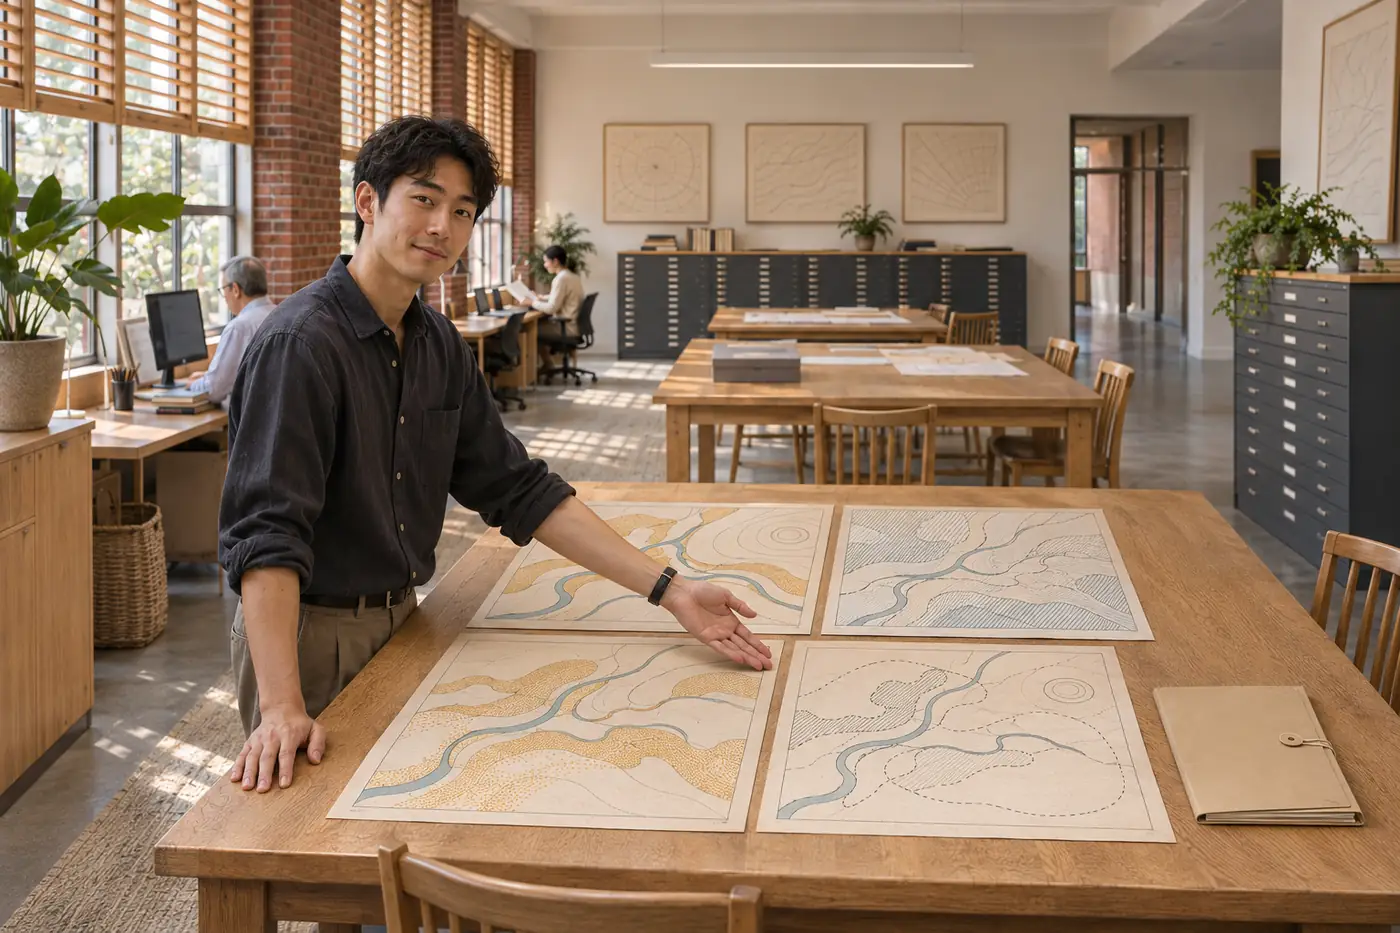
Aiden assembled a fictional coastal reach from four original teaching layers. The first combined map looked complete because each layer used a similar visual weight. Its sources actually described different dates and levels of detail. The project asked how to make those differences part of the map’s reading rather than a footnote available only to a specialist.
Method and record
A source register identifies each invented layer, its teaching date, coverage and intended role. Aiden kept a dated working copy and a short transformation log, then compared two possible map scales. The diagram contains no real survey coordinates and is explicitly unsuitable for navigation, property decisions or the assessment of an actual shoreline change.
TH-TEACH-GEO-01 / Original simulated teaching sources
Original fictional reach; teaching layers
| Layer | Teaching date | Role |
|---|---|---|
| Reach outline | 2026-02 | Context only |
| Observation points | 2026-09 | Selected locations |
| Landward paths | 2025-11 | Schematic circulation |
| Coverage mask | 2026-10 | Shows missing source area |
No real coordinates. The final diagram is a learning illustration, not a geographic or navigation map.
Use schematic scale language, source dates, an explicit missing-coverage pattern and a label stating that these are original invented shapes, not a survey or navigation map.
Download the complete original teaching sourceA revision
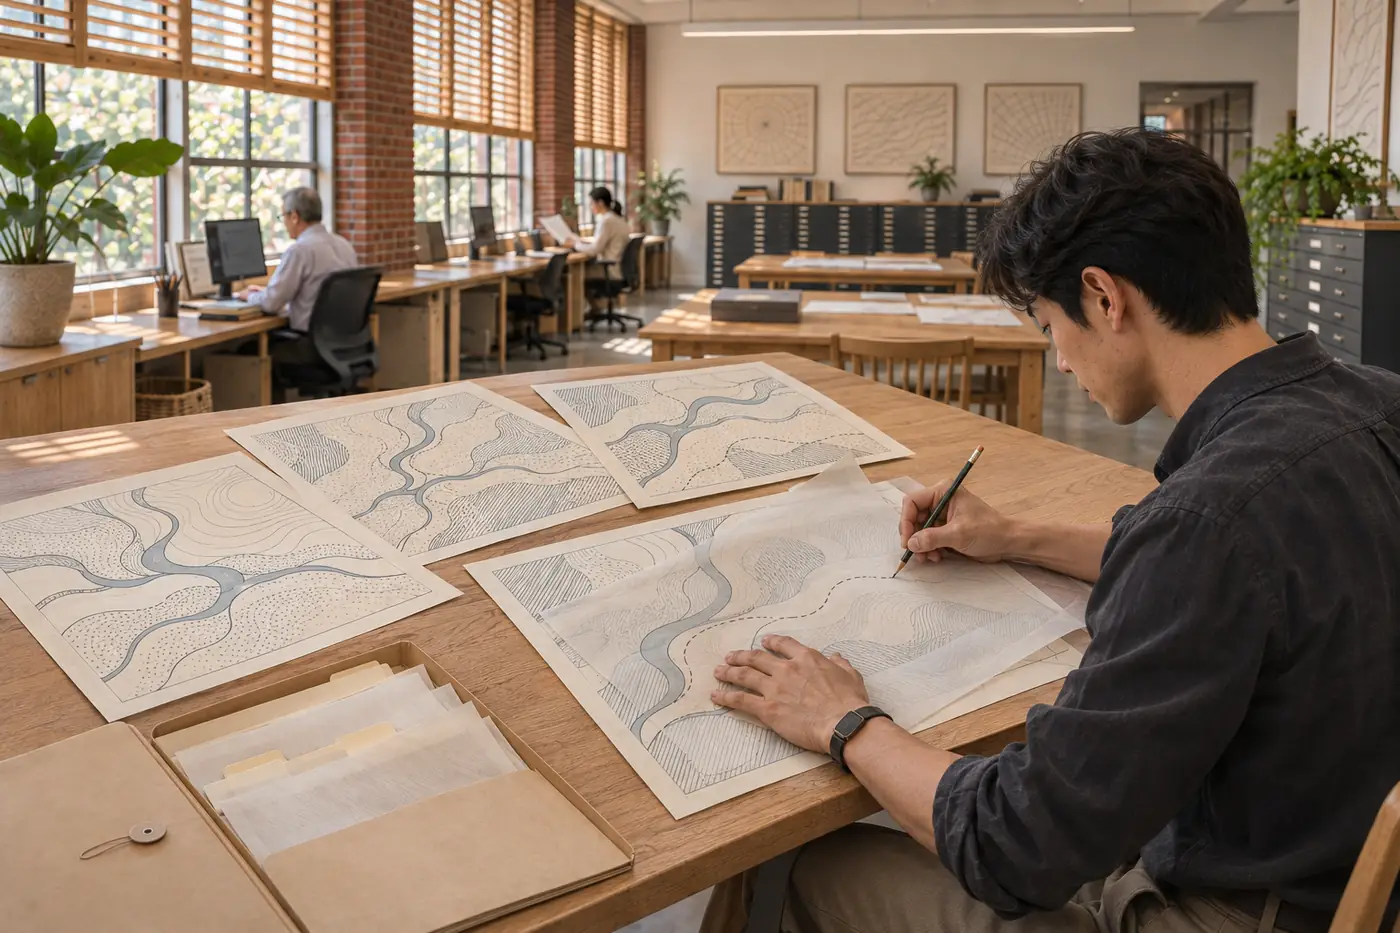
A solid line implied that an uncertain edge had been precisely mapped. Aiden changed the symbol and added a coverage inset that distinguished a missing area from a mapped absence. During peer review, he shortened the legend but retained dates beside the sources so that the simpler layout did not conceal the reason for caution.
What the work shows
The final atlas spread demonstrates how source date, scale and coverage shape a spatial account. Four related panels show the original layer roles before the combined view. The work explains an editing decision and its consequences; it does not establish a real coast’s position or provide a projection of erosion, flooding or future land use.
Next question
Aiden proposes testing the spread with readers from another program to see whether they can identify the oldest source and the uncovered area. The proposed exercise asks about comprehension, not map accuracy. A later real-world project would require appropriate source access, current records and a separate review of its intended use.